The ecommerce business landscape is cluttered with metrics that can be overwhelming to the average business owner.
Owners need to know the key ecommerce metrics that matter the most and monitoring them consistently.
Sadly, most ecommerce business owners find themselves focusing purely on marketing metrics at the expense of other key financial metrics.
While keeping an eye on marketing, you can’t afford to neglect the fundamental ecommerce KPI benchmarks that cover not just marketing, but finance and operations.
This article provides the 5 metrics that actually matter to your business.
The Problem with Ecommerce KPI Benchmarks
For most ecommerce business owners, the sheer number of financial metrics they need to calculate and monitor is a major pain point.
Also customizing the metrics and interpreting what the data means for your specific business and decision-making can be daunting
It gets worse:
- Data organization | To calculate metrics you pull data and aggregate from multiple sources – fulfillment center, supplier invoices, payments for salaries and customer support, Google Analytics, Facebook ads, etc. The further we move from the data source, the more decisions we have to make to arrange the data sensibly – making it more difficult to calculate and consistently monitor.
- Terms | We usually don’t agree on terms. For example, some businesses include shipping costs when calculating gross margin and others don’t. A platform may give you a great rating for a particular metric, but it’s essential we know what they’re including in calculating the metric.
- Perspective | Losing the forest for the trees by overemphasizing marketing metrics. While marketing metrics are crucial, having a meaningful grasp of all the metrics that matter is important for managing your business holistically.
- Comparisons | Metrics are more meaningful when you can compare yourself with other similar businesses. But for the most part, that’s not possible as it’s extremely difficult to access data from private companies.
Ecommerce KPI Metrics that Matter as an Owner
As an ecommerce business owner, you’re probably overwhelmed with metrics – conversion rates, ROAS, attribution models, abandoned cart rates, SEO, repeat purchase rates, etc.
And those metrics are important.
But if you’re putting on your business owner hat, we have to zoom out from the micro and view the business holistically and objectively.
Cutting through the noise, if we could only choose 5 metrics, here is our recommendation (not in order):
- Net Income %
- Inventory Turns
- Quick Ratio
- Contribution Margin %
- CLV
Notice revenue and revenue growth aren’t included. That’s because taking care of these bedrock metrics is more valuable for the overall health of the business.
Note. If you’re VC-backed and not focused on profitability, then fine – they’re going to care more about revenue growth than profitability.
Defining Ecommerce KPI Benchmarks
1. Net Income %
Unfortunately, ecommerce businesses are not usually known for outstanding profit margins. And this metric has become increasingly important as prices have increased, ads are more expensive, and the economy is uncertain.
Owners have to ask themselves the hard question: Am I profitable? By how much?
What is Net Income %?
This is the ratio of net income to sales. Sales can either mean gross or net – depending on your business. Choose what’s most appropriate for you and be consistent. At Ecom CFO, we prefer gross sales in most cases.
What’s good?
Our general opinion is that the best businesses are operating at 15%+ net income %. How do we know this? Through our experience working with dozens of clients selling over $150M+ in combined sales.
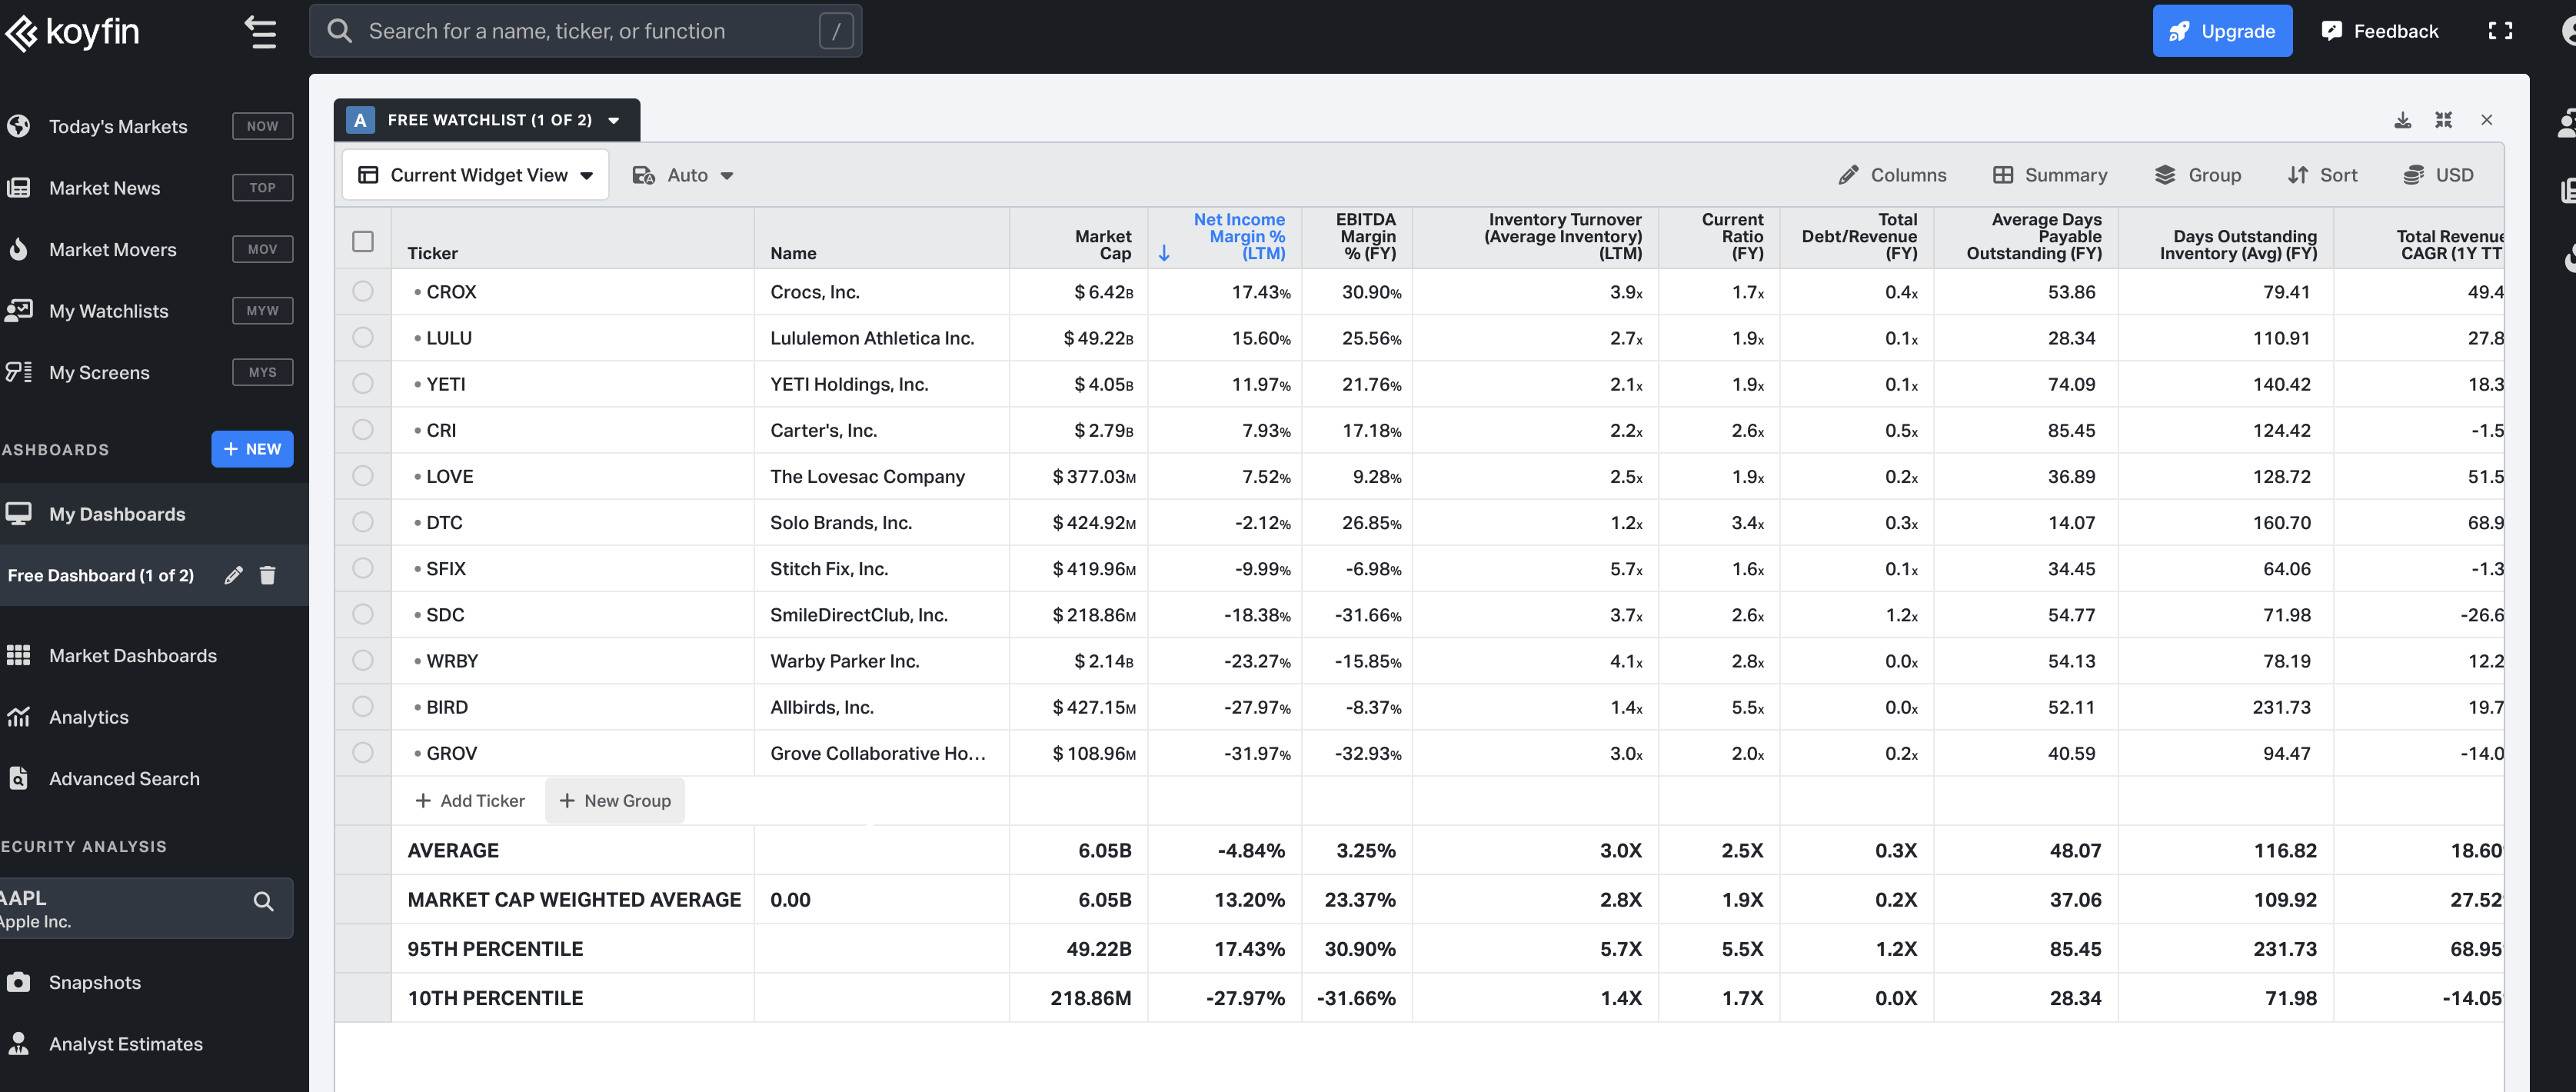
But don’t just take our word for it. Let’s look at some public company data. Below is a chart of 11 publicly traded DTC brands. Yes, we acknowledge some of these have brick-and-mortar stores, but it’s as close as we can get.
The market cap weighted average is – you guessed it – 13.2%. And the 95th percentile is 17%. Notice too that 6 of the 11 companies are losing money – some lots of money.
2. Inventory Turns
Inventory turns (also known as inventory turnover ratio) measures inventory efficiency.
As a business owner, you want to know how much inventory you sold compared to the cost of goods sold over a specified period – let’s say, the last 12 months.
What’s more, by using this metric you can tell how long, on average, your company takes to sell inventory. It ultimately informs how you efficiently deploy company assets and the outcomes of management decisions on purchasing, production, marketing, and pricing.
It’s worth noting that the movement of inventory in a business is dynamic, seasonable (BFCM), varies across industries, and often depends on new product launches.
What is Inventory Turns?
Technically, Inventory Turns measure how efficiently a company uses its inventory by dividing the cost of goods sold by the average inventory value during the period.
What’s good?
From our data on 11 public companies, we see the average inventory turn is 3.0x with the highest company returning 5.7x. The best companies are somewhere around 4.0x.
3. Quick Ratio
The quick ratio indicates your company’s ability to settle its short-term obligations with cash or assets that are easy to convert to cash – that is, accounts receivable (including amounts that Amazon or Shopify owes you), and marketable securities (including your crypto).
More importantly, it shows the businesses’ short-term liquidity standing, and if you risk running out of cash altogether.
That means, if your quick ratio is good, you can pay off current liabilities without having to sell your inventory or seek additional financing from lenders or investors.
What is a quick ratio?
Also known as the acid test ratio, the quick ratio is an indicator of a company’s ability to pay for its current liabilities using cash or assets that are easiest to convert to cash.
To calculate the quick ratio, divide the most liquid assets of your business (cash, accounts receivables, marketable securities) by the aggregate current liabilities.
What’s good?
The best companies have quick ratios 1.5+.
A higher ratio number means you are in a position to settle debts as they arise. If the score is less than 1, then you’re struggling to pay debts and suppliers.
From the data of public companies, we note that the average quick ratio is 1.2x. But, you can see that 6 of the 11 companies are operating at below 1x with the highest at 3.4x.
Note. In highly seasonal businesses, quick ratios drop drastically as businesses ramp up inventory levels prior to large sales months.
4. Contribution Margin %
Contribution margin is a key ecommerce metric for strategic business decisions as it helps you track overall profitability and core unit economics.
What is contribution margin?
Our definition of contribution margin is net sales minus variable costs.
For more on how to calculate contribution margin, read our full article on contribution margin.
What’s good?
The best companies are achieving contribution margin % of 30%.
In higher volume businesses, owners may find 30% unachievable and target closer to 15% or 20%
Note that there is no public data available on this metric. Not that public companies don’t value this metric – just standard accounting principles don’t require it.
5. CLV
Customer Lifetime Value is the total profit that you generate from a customer over the life of that customer.
This metric drives decision-making regarding customer acquisition and retention, product improvement, customer support, and upselling.
If you need help calculating CLTV, check out our article on customer lifetime value.
What’s a good CLV?
This varies widely depending on the period. But generally within a year, anything less than 2 is poor.
Between 2-3 is considered “good”. And 3+ is above average.
Note that an extremely high ratio may indicate an underinvestment in the business.
Note also that – similar to contribution margin % – public data is not available for CLV.
How Time Impacts the 5 Metrics that Matter
Seasonality
From the publicly available data, we used trailing 12 months. You should do what’s most appropriate for your business. But, in general, include a full season.
Black Friday / Cyber Monday and Christmas
Many ecommerce businesses rely heavily on Q4 sales. But, they may fall off in Q1 of the following year. Returns will typically be higher for Q4 followed by a steep drop in Q1. So, again, include a full year or season
Major changes
As much as possible, aim to compare time periods apples to apples. Considering excluding periods with unusual trends that may distort the overall picture of your company. For instance, a sudden spike in sales in a month when you launched a wildly successful product or if your Amazon account was shut down.
Common Mistakes with Ecommerce KPI Benchmarks
- Profitability | Avoiding the reality that you’re not profitable. Negative profitability in a single month or quarter is not necessarily bad. But months/periods of negative profitability should be properly managed and viewed within the constraints of the balance sheet. Simply put, if your balance sheet can’t support months of sustained losses, you better take drastic decisions to improve profitability. This could mean cutting ads, cutting SKUs, and downsizing. It’s not fun but it’s necessary for long-term sustainability.
- Timing | Make sure to define a realistic time period for calculating various metrics. For CLV specifically, viewing data 2+ years out isn’t very insightful. Work with 6 months to 1-year timelines.
- 3rd Party Apps | Some 3rd party apps are awesome. But don’t trust them blindly. You need to intimately understand how the data is being presented as most apps aren’t going to customize the data enough for the nuances of your business. Do the work to calculate the metrics on your own and compare your findings to what the apps are telling you.
Still not sure about Ecommerce KPI?
Schedule a call with us today to learn how to monitor these 5 key metrics.
