Background
Every month we have financial reviews with clients, I hear the exact same question:
“What are you seeing in the market”?
We do have a very unfair advantage of seeing actual P&Ls of brands. It’s, of course, not indicative of the entire industry. But it’s a data point – more reliable than ecom twitter.
If you pay attention and can do basic math, there’s a lot of financial data available on ecommerce podcasts and publicly traded DTC company 10ks.
In ecommerce podcasts, it’s usually unaggregated, anecdotal revenue, marketing, and ROAS focused (+1 to the Operators Podcast – must listen).
In publicly traded DTC’s companies, there is clear revenue and EBITDA data, but nothing about ROAS and contribution margin.
We sit in a unique position to provide the breadth and depth of insights for brands $5M to $100M in revenue.
Once we started to compile the data, my initial reaction was “there’s too much noise and not enough trend”. Big macro events or big internal client decisions skew the data wildly.
But that’s not an excuse to quit. The more I dug, the clearer it became – the noise is the insight. Big stuff happens in the economy, your niche, and/or in your business. It will continue to happen. Change is the only constant.
Objectives
I have a few objectives in publishing this:
- Sharpen our own perspective by actually writing stuff down.
- Deliver unique, leveled up content to our industry where none currently exists.
- Despite the lag in the timing of the data, provide timeless actionable insights.
- Look smart for potential clients.
Notes
- I’m keeping it simple (for now). While there are plenty of other KPIs we could capture and analyze, this project focuses on a few key P&L metrics.
- Comparison period is same month last year unless otherwise noted
- This data is lagging. It takes time for us to close the books, wrap our heads around the data, and present it coherently.
- We’re not a data science shop. We’re a CFO and accounting firm.
April 2024 Data Update
No changes for April. I think we’re in a nice groove from last month.
Cohort | Less than $10M
Facts
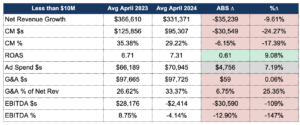
Similar to the performance this cohort had in March of this year, the April results were also challenged.
Revenue on an absolute % change basis declined $35,239 and 9.6% respectively. Unlike March, where brands, in spite of a decline in revenue, CM$s and CM% increased – we’re seeing a decline in CM$s and CM% for April.
Total advertising spend increased 7% versus last April and ROAS improved on average 9%.
General & Administrative (G&A) expenses were essentially flat versus April 2023, but up as a percent of revenue considering the revenue decline.
EBITDA – not surprising considering what you just read – was down both in $s and %.
Specifically, brands in this cohort were profitable on average April 2023, whereas they were unprofitable this April.
CFO Interpretation
Usually CM% follows ROAS. If ROAS is up, CM% is up and vice versa.
So, if ROAS is up and CM% is down, what does that tell me?
Our interpretation…
- Bigger focus on wholesale reduces margins and makes ROAS look better than it probably is
- Inflation is still happening and brands are slow / reluctant to continue raising prices
- We’re not seeing as many new product launches in this cohort – not just in April – but in 2024 in general. Product launches usually result in big bumps in revenue and CM.
- Related to ^, we rarely hear of brands with rigid policies around intentionally pausing and/or sunsetting less profitable SKUs. This may be because we don’t have full visibility into all of our clients’ operations, but we sure wish they would ask us to help.
Still concerning is the negative leverage the cohort is getting on G&A expenses – meaning companies haven’t really affected meaningful reductions in overhead spending, in spite of the steeper decline in year-over-year revenue, for another consecutive month.
As a CFO, I would still love to see more creative solutions in managing fixed costs in these low months to at least <25% of revenue.
Cohort | Between $10M and $50M
Facts
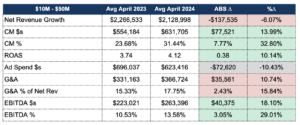
Similar to brands <$10M, a high-single-digit decline for the overall cohort in revenue versus last April.
The $10M-$50M cohort experienced unfavorable Revenue and CM (declines in both) in February/March, but made it into the green in April – with Ad spend down over 10% and ROAS up 10% YoY.
Again, however, like in February- March, brands in this cohort have increased fixed costs. With the decline in revenue, G&A as a percentage of revenue increased to 17.8%vs. 15.3% last year.
EBITDA $s and EBITDA % were better vs. last year due to the improvement in contribution margin.
CFO Interpretation
Individually parsing through the results, revenue stories within the cohort are truly brand-specific, as I called out in my March 2024 Benchmarking article.
We had some brands post significant YoY increases in April, driven by product launches or channel expansion, while others posted varying levels of decline (slightly down to -50% YoY).
But would you look at that CM%!
Few things make us CFOs happier than seeing 30%+ CM% – a 32.8% increase from last April.
Even better, the 10% increase in ROAS doesn’t fully explain it, meaning brands improved margins by not just improving ad campaigns.
I’m still concerned about the increase in G&A, despite the increase in EBITDA. I think brands in this cohort could squeeze another 1%-2% in EBITDA by reducing spend down to <15% of revenue.
Overall, from seeing all red last month, April 2024 was a great bounce back.
Cohort | Greater than $50M
Facts
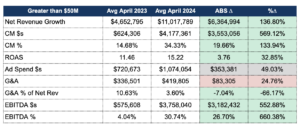
Revenue for this cohort continued to increase YoY in April and for consecutive months since February.
CM$s and CM% both increased dramatically versus prior year.
ROAS increased 32.85% with ad spend actually increased by 50%.
G&A did increase an average of $83k per month but was far outpaced by the revenue and margin improvement.
Brands in this cohort improved EBITDA $s a staggering $3M+ from last year and EBITDA % 26.7%
CFO Interpretation
I’ll say it for you – the rich got richer.
While smaller brands ad spend was flat or down, these larger brands were able to profitably scale ad campaigns.
With the relatively small increase in G&A, the vast majority of added contribution margin flowed directly to the bottom line.
Anecdotally, brands within this cohort added new SKUs since last year and bolstered their wholesale business.
Great month for the bigger brands.
How to Be Better
Stick with me on this one.
My girlfriend and I have developed a great habit of going to couple’s therapy every month.
We don’t have any major issues, but it’s been a great way for us to better understand each other and build a stronger foundation – highly recommend.
Usually, I like to start each session by saying something positive – something I really appreciate(d) about her, something I’m thankful for, etc.
Last session, however, a small argument started in the car carried over into the start of our session, so I wasn’t granted my usual opportunity to say something positive.
This session itself was a tougher one, and nearing the end, it felt like we were going to leave as bad or worse than we started.
I didn’t like that.
With about 15 minutes left, I said “can we end with something positive”?
Our therapist looked at me and said “you don’t like negativity, do you”?
Me: “please say more”.
Therapist: “It seems from all of our sessions that you don’t like to dwell in the negative and you’re always spinning your past and situations positively”.
I’ll save the why and the childhood trauma for another article, but I’ve been chewing on his words and the application to our business (and my relationship) ever since.
As entrepreneurs, I think two of the most important (and conflicting) traits we can have are paranoia and existential optimism. If we don’t believe things will work out in the long term, what’s the point in trying to grow our business? But if we’re not paranoid about the success of marketing campaigns, shipment delays, and employee performance, disappointment usually follows.
I ask that you apply a healthy dose of both to your financials – me included. Let’s dwell a little longer in the negative and make sure we spend enough time addressing those parts of the business where you’re not 100% confident.
Optimism is a mindset, not a solution. Analysis, decisions and execution are.
Optimism is a mindset, not a solution. Analysis, decisions and execution are.
Last Month’s Timeless Recommendations
Redo Unit Economics
Regardless of size, redo the math on your unit economics. And then doublecheck line by line. And then triple check it. Use a sensitivity table like this one
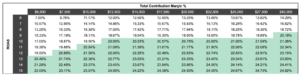
to understand the interplay between increasing customer acquisition costs and accepting a lower contribution margin %. Know the game you are playing.
Terms and Targets
Make sure your department heads and agencies are on the same page on TERMS AND TARGETS. How do your marketing teams and agencies define contribution margin? What’s included in COGS?
When is the last time they’ve updated their targets? Make them put it on paper and share with you. No hand waving.
Budget Enforcement
Lastly, increase your vigilance of enforcing budgets. It’s ok to spend more. It’s ok to test that new thing or hire that new person.
But similar to unit economics, those dollars should have a plan and a purpose. And if the environment changes, the budget should change with it. Your balance sheet can only support a finite amount of “well I guess we’ll try again next month”.
If you want to chat, here’s my calendar.
Until next month,
Sam
