Background
Every month we have financial reviews with clients, I hear the exact same question:
“What are you seeing in the market”?
We do have a veryunfair advantage of seeing actual P&Ls of brands. It’s, of course, not indicative of the entire industry. But it’s a data point – more reliable than ecom twitter.
If you pay attention and can do basic math, there’s a lot of financial data available on ecommerce podcasts and publicly traded DTC company 10ks.
In ecommerce podcasts, it’s usually unaggregated, anecdotal revenue, marketing, and ROAS focused (+1 to the Operators Podcast – must listen).
In publicly traded DTC’s companies, there is clear revenue and EBITDA data, but nothing about ROAS and contribution margin.
We sit in a unique position to provide the breadth and depth of insights for brands $5M to $100M in revenue.
Once we started to compile the data, my initial reaction was “there’s too much noise and not enough trend”. Big macro events or big internal client decisions skew the data wildly.
But that’s not an excuse to quit. The more I dug, the clearer it became – the noise is the insight. Big stuff happens in the economy, your niche, and/or in your business. It will continue to happen. Change is the only constant.
Objectives
I have a few objectives in publishing this:
- Sharpen our own perspective by actually writing stuff down
- Deliver unique, leveled up content to our industry where none currently exists.
- Despite the lag in the timing of the data, provide timeless actionable insights.
- Look smart for potential clients.
Notes
- I’m keeping it simple (for now). While there are plenty of other KPIs we could capture and analyze, this project focuses on a few key P&L metrics.
- Comparison period is same month last year unless otherwise noted
- This data is lagging. It takes time for us to close the books, wrap our heads around the data, and present it coherently.
- We’re not a data science shop. We’re a CFO and accounting firm.
June 2024 Data Update
As a reminder, last month, we added a new KPI – inventory as a % of revenue.
Our definition: [LTM Average Inventory] / [LTM Net Revenue]
Similar to ad spend, we’ve conditionally formatted this KPI as gray as it’s not necessarily good or bad.
Cohort | <$10M

Facts
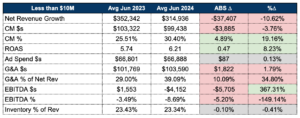
For the fourth straight month, we’re seeing a decline in Net Revenue versus prior year. Net Revenue on an absolute $s and % change basis declined $36,659 and 10.42% respectively.
Despite the revenue decline, brands in this cohort CM% increased marginally – primarily due to the increase in ROAS. This 10% increase in ROAS is the highlight for brands in this cohort this month.
G&A $s were down $2,022 – which means brands cut costs slightly.
EBITDA was down both in $s and %. Although brands increased CM$s, it was not enough to offset the decline in net revenues.
CFO Interpretation
Generally, June was a “meh” month for this cohort.
Yes, CM% increased primarily due to ROAS improving, but I’m still hammering on G&A spend. Since absolute CM dollars declined by $4k, the marginal savings in G&A wasn’t enough to offset.
So, brands were, on average, less profitable than last June.
I said this last month, and I’m going to say it again. I know it’s easy for us as CFOs to advise cost cutting. These are probably people we’re talking about. These are initiatives you have to put on hold or cancel altogether. But, you can either make a hard decision now or a really hard decision in the future.
From our conversations with clients in this cohort, there are two who have made significant (and very different) cost cutting decisions – and are ultimately glad they did it.
One decided to take fulfillment inhouse and the other eliminated their marketing manager. Hard choices. But it gave them renewed perspective into some leaky parts of the business and is now making a meaningful percentage impact to the bottom line.
Cohort | Between $10M and $50M

Facts
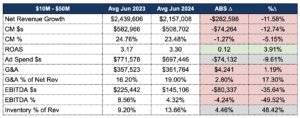
A very similar, albeit exacerbated narrative in June for this cohort compared to brands <$10M
Similarities:
- Double digit revenue decline
- Marginal pullback in ad spend
- Margin improvement in ROAS
- Declining absolute CM$s
Brands in this cohort cut ad spend ~10%, contributing to a decline in CM$s of $74,264.
Similar to brands <$10M, G&A remained constant, meaning the decline in CM$s flows directly to the bottom line.
Notice that brands in this cohort were still profitable in June, although their EBITDA % was cut in half to 4.32%
CFO Interpretation
I want to swing the cost cutting hammer on this cohort too.
But I’d like to first draw your attention to CM%. At this level of scale, every 1% of CM% is $21,570 ($2,157,008 * .01) that flows directly to the bottom line.
ROAS aside, this could be a combination of many small margin leaks: open discount codes, 3PL increased rates, more wholesale orders, customers bought more low margin products, return rates increased, etc.
As an owner, it’s your responsibility to understand these changes, assign accountability, and manage results.
Cohort | Greater than $50M

Facts
Revenue for this cohort continued to increase YoY in June and for consecutive months since February.
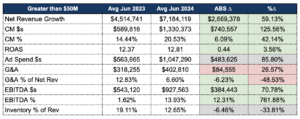
The only cohort to see net revenue growth. On average, this cohort added an additional $2.7M in net revenue, a 60% increase from last year.
Contribution Margin also increased in both $s and %, $740k and 42.14% respectively. Moreover, brands actually increased ROAS on significantly more ad spend.
EBITDA $s in this cohort improved $384,443 or 70.78%. Brands increased EBITDA % from 1.62% in June 2023 to 13.93% this year.
CFO Interpretation
I said this last month, but if you’re reading this as a brand <$50M, please let the above chart enter your brain as motivation and not resentment.
Brands in this cohort are having very different conversations than others. Questions like:
- How do I leverage my strong balance sheet?
- What does treasury management look like?
- Where is the next level of growth coming from?
- How do I get further ahead?
Last month, I noticed the dust settling for both the >$50M cohort and the previous cohort at around 13% for inventory as a % of revenue. This is the second consecutive month we’ve landed around 13%. As a brand owner in this cohort, I may be a little concerned about low inventory levels given the revenue growth, but this is will vary widely from brand to brand.
How to Be Better
We all agree on Taylor Holiday’s wisdom and authenticity in the ecommerce world.
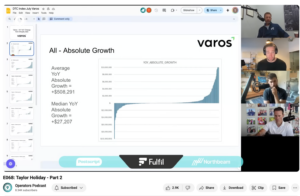
His most recent episode on the The Operators Podcast is a must listen for all ecommerce owners. I think it’s a must listen for all business owners, given Taylor’s (DTC Index) application and lessons from statistics.

One of Taylor’s principal points is observing the median versus average – the median, in most cases, is lower than the average. Meaning, his observation is the majority of stores are experiencing little to no growth. Fair enough. His data set covers thousands of stores, for better or worse.
As an owner making big decisions for the remainder of the year, Taylor’s findings should be one input to your decision making.
To build on Taylor’s observations, I want to remind owners of some of the distinctions between Taylor’s data set and ours.
One, the DTC Index data doesn’t cover profitability, which is the thing we care most about. Yes, revenue is a decent indicator but it’s not the full picture.
The data also doesn’t include revenue mix – wholesale versus DTC. We’ve seen a big shift with our clients into wholesale. If these clients are running wholesale orders through a Shopify store – whether Shopify’s B2B function or a different store altogether – DTC index data set wouldgenerally include it – we just wouldn’t see the breakdown. However, any wholesale orders taken off Shopify would be excluded.
Lastly, I didn’t see any data presented on change in price. Maybe this is included in the paid subscription – fair enough. But as a CFO advising clients, I’m more ok with less topline if we’ve increased our gross margins via price increases.
Please know I’m not disagreeing with Taylor and the DTC index. Rather, I’m offering additional context and another lens by which ecommerce owners should ingest market data and ultimately make better decisions.
If you want to chat, here’s my calendar.
Until next month,
Sam

