Background
Every month we have financial reviews with clients, I hear the exact same question:
“What are you seeing in the market”?
We do have a very unfair advantage of seeing actual P&Ls of brands. It’s, of course, not indicative of the entire industry. But it’s a data point – more reliable than ecom twitter.
If you pay attention and can do basic math, there’s a lot of financial data available on ecommerce podcasts and publicly traded DTC company 10Ks.
In ecommerce podcasts, it’s usually unaggregated, anecdotal revenue, marketing, and ROAS focused (+1 to the Operators Podcast – must listen).
In publicly traded DTC’s companies, there is clear revenue and EBITDA data, but nothing about ROAS and contribution margin.
We sit in a unique position to provide the breadth and depth of insights for brands $5M to $100M in revenue.
Once we started to compile the data, my initial reaction was “there’s too much noise and not enough trend”. Big macro events or big internal client decisions skew the data wildly.
But that’s not an excuse to quit. The more I dug, the clearer it became – the noise is the insight. Big stuff happens in the economy, your niche, and/or in your business. It will continue to happen. Change is the only constant.
Objectives
I have a few objectives in publishing this:
- Sharpen our own perspective by actually writing stuff down
- Deliver unique, leveled up content to our industry where none currently exists.
- Despite the lag in the timing of the data, provide timeless actionable insights.
- Look smart for potential clients.
Notes
- I’m keeping it simple (for now). While there are plenty of other KPIs we could capture and analyze, this project focuses on a few key P&L metrics.
- Comparison period is same month last year unless otherwise noted
- This data is lagging. It takes time for us to close the books, wrap our heads around the data, and present it coherently.
- We’re not a data science shop. We’re a CFO and accounting firm.
March 2024 Data Update
Last month, we presented more aggregated data and only broke out a few metrics by cohort.
This month, I’m really excited about this next round of improvements!
Specifically, we are now segregating all benchmarks into three cohorts by annual revenue:
- Less than $10M
- Between $10M and $50M
- Greater than $50M
We’ve also included the averages instead of only presenting the absolute and percentage changes.
Finally, we frequently get the question about G&A as a % of revenue and total advertising dollars, so we’ve included those as well.
Cohort | Less than $10M
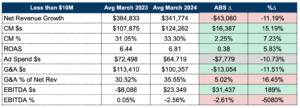
Facts
We’re seeing a decline in revenue versus last March on both an absolute ($43,060) and percentage (11.19%) basis.
Despite the decline in revenue growth, brands in this cohort increased CM$s and CM%.
ROAS also improved ~5% as brands appeared to pull back spend by ~11%.
*Note, change in ad spend is indicated as gray because we don’t see it as positive or negative. It’s just important to measure ROAS and total ad spend in tandem.
General & Administrative (fixed) costs also improved by $13,054 versus March 2023.
EBITDA is a mixed bag.
Brands did improve $ profitability by $31,437 on average. However, as a percentage, brands actually declined 2.6% on an absolute basis.
I acknowledge the data is a little strange here. To maintain consistency, we didn’t calculate these as a weighted average which would have shown slightly more consistent results.
CFO Interpretation
Is it a coincidence that average net revenue growth is down within one percent of declining ad spend $s? I sincerely doubt it.
Anecdotally, I don’t recall many clients launching new products or new channels this March with a few exceptions – Tik Tok Shop and Faire.
So, in the absence of something new, brands are selling the same products to the same customers.
While we’re on anecdotal evidence, this may be because we don’t have the visibility into all of our clients’ operations, but I rarely hear of brands with rigid policies around intentionally pausing and/or sunsetting less profitable SKUs.
I digress…
Back to the data…
It pains me to see G&A as a % of revenue so high. For those doing math at home, if your contribution margin is 33% and your G&A as a percentage of revenue is 35% (2% higher), your EBITDA % is negative!
March is usually a rough month for ecommerce profitability. We all know this.
My fear, though, is brands are too reliant on the hope that they will make it up later in the year – which makes the high G&A look better than it really is.
Brands did clearly pull back on fixed costs, cutting $13,054 on average. But this wasn’t enough to make up for the decline in net revenue.
As a CFO, I would love to see more creative solutions in managing fixed costs in these low months to at least <25% of revenue.
Cohort | Between $10M and $50M
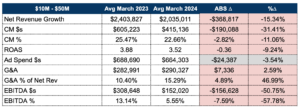
Facts
If you’ve skipped the rest of the article to only read about the cohort directly related to you, I strongly encourage you to read the Facts and Interpretation sections for the cohort above.
Similar to brands <$10M, we’re seeing a decline in revenue versus March 2023 on both an absolute ($368,817) and percentage (15.34%) basis. Unfortunately, CM$s and CM% declined as well.
Unlike brands <$10M, ROAS AND Ad Spend $s both declined.
It gets worse…
Brands in this cohort increased fixed costs a marginal $7,336 on average from March 2023.
With the decline in revenue, G&A as a percentage of revenue increased to 15.29%, up 47% from last year.
EBITDA $s and EBITDA % are both down significantly, 50.75% and 57.78%, respectively.
CFO Interpretation
This section was the toughest to write this month.
I went down a really deep rabbit hole looking at the Bureau of Labor Statistics and analyzing trends in income and consumption for non durable goods.
Then I forgot I was reading Titan, Rob Chernow’s masterpiece on John D Rockefeller.
Rockefeller (a bookkeeper by trade) made much of his own success analyzing his own business more carefully. He would have used the paper of Bureau of Labor Statistics and government reports for things inappropriate to mention in this article.
So I went back to the underlying data…
Although there were a couple brands with outsized declines, two brands had positive revenue growth. Also, of the brands whose revenue declined, the losses vary significantly.
Meaning, brands in this cohort are still the captains of their own ships.
You may need to replace the rudder, change the crew, and patch up the sails – and yes, the wind matters – but ultimately YOU are in control.
In the future, when I see all revenues down the same percentage, we can all blame the market together. Until then, let’s work through solutions together.
Cohort | Greater than $50M
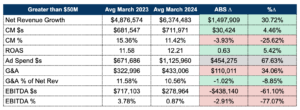
Facts
Brands >$50M increased revenue both on an absolute ($1,497,909) and percentage (30.72%) basis from March 2023 to March 204. The only cohort this month to increase revenue.
Unlike the other two cohorts, brands >$50M actually increased ad spend by an average of $454,275, and surprisingly, ROAS also increased by 5.42%.
On average, brands in this cohort added $110,011 in G&A costs – mostly headcount, fixed marketing, and other administrative expenses. However, G&A as a % of revenue declined 1.02% to 10.56%.
CFO Interpretation
Why would CM% decline by ~4% when ROAS is improving?
I would have expected CM% to improve given the increase in ROAS?
CFO re-analyzes data…
Turns out, it didn’t! A large client in this data set was performing so well, they ran out of inventory but kept selling on backorder. Since the data we present is only from the P&L, we didn’t include the additional customer deposits but we did include the ad spend to acquire these customers.
This means the decrease in EBITDA $s and EBITDA% are also understated – changing the narrative significantly.
Once I realized this, I considered rewriting this section altogether.
But I wanted to illustrate an important lesson to all you brand owners out there – keep questioning the data and the source of the data (even if it’s from a world renowned outsourced CFO firm)! For the record, the data wasn’t “incorrect” – just a different view.
If a KPI or benchmark doesn’t smell right to you, ask more questions.
Particularly with larger brands, complexity is only increasing. Ask your team and/or agencies to show formulas and methodologies for how data is compiled.
If you read the interpretation of the cohort between $10M and $50M, I said we are still captains of our own ships. This also means we are captains of our data.
How to Be Better
Chances are you didn’t read last month’s recommendations. I worked hard on those and they’re timeless, so I’m including them again.
And because I’m an overachiever, I’m sharing an additional story from a client interaction that I think exemplifies a great brand <> fractional CFO firm relationship.
Additional story…
We had a client come to us last month with something that would warm any CFO’s heart.
This is only the second year this client has had a real budget. But of all our clients, this client is probably the most vigilant in defining spend and reallocating when initiatives (inevitably) go over budget.
After a disaster photoshoot went $15,000 over budget, this client came to us proactively with their plan to makeup for the overage.
They would take from the previously budgeted “brand initiative” to compensate for the loss. They also decided to cut the planned hire for a full time content strategist and instead decided on a part time resource – with the owner working overtime to fill the gap.
Please, whether it’s us or someone else, build a budget and manage to it.
February’s timeless recommendations:
Redo Unit Economics
Regardless of size, redo the math on your unit economics. And then doublecheck line by line. And then triple check it. Use a sensitivity table like this one
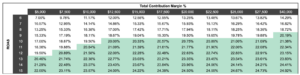
to understand the interplay between increasing customer acquisition costs and accepting a lower contribution margin %. Know the game you are playing.
Terms and Targets
Make sure your department heads and agencies are on the same page on TERMS AND TARGETS. How do your marketing teams and agencies define contribution margin? What’s included in COGS?
When is the last time they’ve updated their targets? Make them put it on paper and share with you. No hand waving.
Budget Enforcement
Lastly, increase your vigilance of enforcing budgets. It’s ok to spend more. It’s ok to test that new thing or hire that new person.
But similar to unit economics, those dollars should have a plan and a purpose. And if the environment changes, the budget should change with it. Your balance sheet can only support a finite amount of “well I guess we’ll try again next month”.
If you want to chat, here’s my calendar.
Until next month,
Sam
