Background
Every month we have financial reviews with clients, I hear the exact same question:
“What are you seeing in the market”?
We do have a very unfair advantage of seeing actual P&Ls of brands. It’s, of course, not indicative of the entire industry. But it’s a data point – more reliable than ecom twitter.
If you pay attention and can do basic math, there’s a lot of financial data available on ecommerce podcasts and publicly traded DTC company 10ks.
In ecommerce podcasts, it’s usually unaggregated, anecdotal revenue, marketing, and ROAS focused (+1 to the The Operators Podcast – must listen).
In publicly traded DTC’s companies, there is clear revenue and EBITDA data, but nothing about ROAS and contribution margin.
We sit in a unique position to provide the breadth and depth of insights for brands $5M to $100M in revenue.
Once we started to compile the data, my initial reaction was “there’s too much noise and not enough trend”. Big macro events or big internal client decisions skew the data wildly.
But that’s not an excuse to quit. The more I dug, the clearer it became – the noise is the insight. Big stuff happens in the economy, your niche, and/or in your business. It will continue to happen. Change is the only constant.
Objectives
I have a few objectives in publishing this:
- Sharpen our own perspective by actually writing stuff down
- Deliver unique, leveled up content to our industry where none currently exists.
- Despite the lag in the timing of the data, provide timeless actionable insights.
- Look smart for potential clients.
Notes
- I’m keeping it simple (for now). While there are plenty of other KPIs we could capture and analyze, this project focuses on a few key P&L metrics.
- Comparison period is same month last year unless otherwise noted
- This data is lagging. It takes time for us to close the books, wrap our heads around the data, and present it coherently.
- We’re not a data science shop. We’re a CFO and accounting firm.
May 2024 Data Update
We added a new KPI – inventory as a % of revenue.
Our definition: [LTM Average Inventory] / [LTM Net Revenue]
Similar to ad spend, we’ve conditionally formatted this KPI as gray because an increase/decline is not inherently positive/negative – it just is.
Cohort | Less than $10M
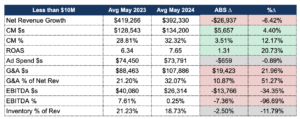

Facts
For the third straight month, we’re seeing a decline in Net Revenue versus prior year. Net Revenue on an absolute $s and % change basis declined $26,937 and 6.42% respectively.
Despite the revenue decline, brands in this cohort CM increased marginally – primarily due to the increase in ROAS. This 20% increase in ROAS is the highlight for brands in this cohort this month.
EBITDA was down both in $s and %. Although brands increased CM$s, it was not enough to offset the increase in G&A.
G&A $s were up $19,423, a 22% increase from May 2023.
One final callout is Inventory as a % of Revenue. Brands in this cohort are carrying 11.79% less inventory than last year.
CFO Interpretation
I’m going to keep repeating this every article until someone pays attention: if everything stays relatively the same, but fixed costs increase, profitability goes down.
There’s lots of green and red in the chart above, but the two biggest numbers changing are G&A $s and EBITDA $s.
I know it’s easy for us as CFOs to advise cost cutting. These are probably people we’re talking about. These are initiatives you have to put on hold or cancel altogether. But, you can either make a hard decision now or a really hard decision in the future.
As a CFO, I would still love to see more creative solutions in managing fixed costs to at least <25% of revenue.
Cohort | Between $10M and $50M
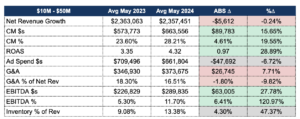
Facts
Brands in this cohort performed very similarly to brands <$10M, with one key difference.
Similarities:
- Marginal revenue decline
- Marginal pullback in ad spend
- ~20% improvement in ROAS
- ~20% improvement in CM%
- Increase in G&A from last year
Key Difference: an increase in EBITDA $s and %.
EBITDA $s in this cohort improved $63,005 or 27.78%. Brands more than doubled their EBITDA % from 5.3% in May 2023 to 11.7% this year.
We did see brands in this cohort increase inventory from last year to ~13.38%.
CFO Interpretation
We saw a great bounce back last month from this cohort, and May is a second consecutive win, despite the small net revenue decline.
Yes, this cohort pulled back marginally on ad spend from last year, but the total CM$ increase was more than double the decline in ad spend. Meaning, brands in this cohort made other meaningful (presumably lasting) changes.
Yes, similar to the <$10M cohort, these brands also increased G&A. However, because of the improved CM, brands in this cohort were more profitable – almost 12% EBITDA%.
Something we’re monitoring is the change in inventory as a % of Revenue. This is probably due to brands not hitting their revenue targets and, therefore, carrying extra inventory, but we’ll confirm as we track this KPI over the next few months.
Cohort | Greater than $50M
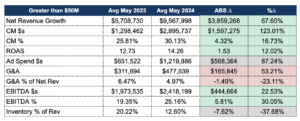
Facts
Revenue for this cohort continued to increase YoY in May and for consecutive months since February.
The only cohort to see net revenue growth. On average, this cohort added an additional $3.8M in net revenue, a $68% increase from last year.
Contribution Margin also increased in both $s and %, $1.6M and 4.32% respectively. Moreover, brands actually increased ROAS on significantly more ad spend.
Comparing to other cohorts, the increase in ROAS wasn’t as significant (less than 20%), but this would be expected given the increase in ad spend $s.
EBITDA $s in this cohort improved $444,664 or 22.53%. Brands increased EBITDA % from 19.35% in May 2023 to 25.16% this year.
CFO Interpretation
I don’t think I need to say it, but wow. Another stellar month for this cohort.
If you’re reading this as a brand <$50M, please let the above chart enter your brain as motivation and not resentment.
Brands in this cohort are having very different conversations than others. Questions like:
- How do I leverage my strong balance sheet?
- What does treasury management look like?
- Where is the next level of growth coming from?
- How do I get further ahead?
I’m also very interested in the inventory story for this cohort. I would expect inventory as % of revenue to decline given the 68% increase in revenue. My thesis is that brands in this cohort are actually exceeding their revenue forecasts, and therefore, carrying less inventory.
It’s interesting, though, to see the dust settle for both the >$50M cohort and the previous cohort at around 13% for inventory as a % of revenue. We’ll see over the next few months if this is pure coincidence or a new benchmark.
How to Be Better
The importance of knowing where you are.
Do you remember the story about the guy trying to cross the English channel? Long story short, it was a foggy day and he quit just a few hundred yards from the other side. Why? Because he couldn’t see the finish.
In a recent client meeting, the client seemed really bummed about their COGS increasing above their target. We spent 30 minutes just talking about why and strategies to improve. I could feel the stress and defeat in his tone.
Looking at the bigger picture, this client is achieve TWENTY PERCENT EBITDA year to date.
If he would just read our benchmarking articles, he would know just how successful he is!
And to save you the effort in scrolling back through the charts, 20% EBITDA is in the top 1% of entrepreneurs not just in ecommerce but period.
The world around him was foggy. But the beauty of the business world is we can remove the fog around us and gain clarity on where we stand.
If you want to chat, here’s my calendar.
Until next month,
Sam
