Table of Contents
- Background
- Objectives and Notes as of Feb 2024
- The Data
- Our Interpretation and How to Be Better
Background
Every month we have financial reviews with clients, I hear the exact same question:
“What are you seeing in the market”?
We do have a veryunfair advantage of seeing actual P&Ls of brands. It’s, of course, not indicative of the entire industry. But it’s a data point – more reliable than ecom twitter.
If you pay attention and can do basic math, there’s a lot of financial data available on ecommerce podcasts and publicly traded DTC company 10Ks.
In ecommerce podcasts, it’s usually unaggregated, anecdotal revenue, marketing, and ROAS focused (+1 to the Operators Podcast – must listen).
In publicly traded DTC’s companies, there is clear revenue and EBITDA data, but nothing about ROAS and contribution margin.
Queue us…
We sit in a unique position to provide the breadth and depth of market insights for brands $5M to $100M in revenue.
So, beginning with data from February 2024, we’re going to publish a roundup of what we’re seeing in the market across our client base, and we’ll improve over time.
Once we started to compile the data, my initial reaction was “there’s too much noise and not enough trend”. Big macro events or big internal client decisions skew the data wildly.
But I’m not a quitter.
The more I dug, the clearer it became – the noise is the insight. Big stuff happens in the economy, in your niche, and in your business.
It will continue to happen. Change is the only constant. The universe doesn’t hear your excuses.
Objectives and Notes as of Feb 2024
Objectives
Stating my objectives in publishing this:
- Your perspective sharpens when you actually write down your thoughts
- Deliver unique, leveled up content to our industry where none currently exists
- Despite the lag in timing to close books and meet with clients, provide ageless actionable insights
- Look smart for potential clients (we gotta eat)
Notes as of Feb 2024
- I’m keeping it simple (for now). While there are plenty of other KPIs we could capture and analyze, this project focuses on a few key P&L metrics
- Comparison period is same month last year unless otherwise noted
- This data is lagging over a month. It takes time for us to close the books, wrap our heads around the data, and present it coherently
- We’re not a data science shop. We’re a CFO and accounting firm
The Data
Terms Guide
- ∆ = when reading this symbol, replace with the word “change”
- ∆% = [Current Month] – [Previous Month] / [Previous Month]
- ABS = “absolute”
- Trim Avg = the average with 30% of top and bottom outliers removed
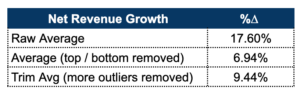
Revenue Growth ⬆️
On average, revenue growth from February 2023 to February 2024 is positive across our client base.
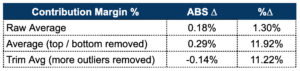
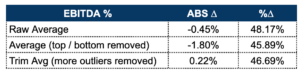
Contribution Margin: Dollars ⬆️, Percentage 🪓 (choppy)
On average, contribution margin dollars (not %) generally increased from February 2023 to February 2024.
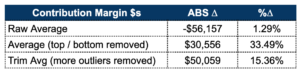
As a % change, CM% appears positive. Looking at the absolute change, however, CM%s are effectively flat (How to read ABS ∆: a brand went from 15% CM in Feb 2023 to 15.29% in Feb 2024).
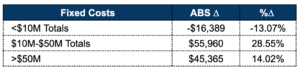
Fixed Costs: Smaller Brands ⬇️, Bigger Brands ⬆️
Fixed costs was the interesting data point this month for me. On average, our clients added roughly $15k per month in fixed costs ($180k annualized).
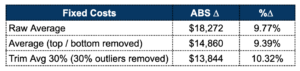
HOWEVER, when we separate clients into cohorts, brands <$10M actually reduced fixed costs an average of $16,389 per month while clients in the $10M to $50M cohort increasedfixed costs by an average of $55,960 per month.
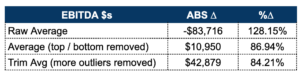
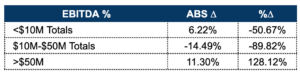
EBITDA: Dollars ⬆️, Percentage 🪓 (choppy)
Unsurprisingly, EBITDA follows the story of contribution margin. If brands added more contribution margin dollars at less efficiency, an increase in EBITDA dollars follows – as long as the increase in fixed costs doesn’t eat the entire increase in contribution margin.
However, remember in the previous section we saw brands in the $10 to $50M cohort increase fixed costs by $55k per month? While they did add more EBITDA dollars, the absolute percentage decreased by almost 15%.
Our Interpretation and How to Be Better
Explaining ∆ in Unit Economics
Hypothesis
In the 12 months between Feb 2023 and Feb 2024, brands increased prices, optimized discounting, cut some low performing SKUs, made some optimizations in reverse logistics (return policies, restocking returned units, etc), and made strides to reduce reliance on paid ads.
They also deployed a net increase in customer acquisition dollars (paid social, paid search, direct mail, SMS, affiliate commissions, etc).
This would explain the (less noisy) increase in net revenues and CM$s accompanied by the choppiness in CM%.
Explaining ∆ in Fixed Costs
Hypothesis
Smaller brands are generally monitoring fixed costs more closely since…
- There’s less to manage
- They are less likely to be able to fall back on credit lines
- They are generally closer to the numbers since they don’t have as many department heads managing their own budgets
Larger brands increased fixed costs by…
- Increasing head count expecting to have a better 2024
- Increasing spend on indirect customer acquisition: content, studios, brand, other agencies
- Inherently being less nimble – longer contracts, higher switching costs
Also, friendly reminder inflation hasn’t gone away – despite the Fed promising rate cuts this year. Stuff is more expensive, so I would expect fixed costs to at least increase at the rate of inflation (3%-4%).
How to Be Better
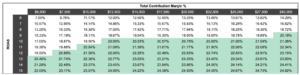
- Regardless of size, redo the math on your unit economics. And then doublecheck line by line. And then triple check it. Use a sensitivity table like the one below to understand the interplay between increasing customer acquisition costs and accepting a lower contribution margin %. Know the game you are playing.
- Make sure your department heads and agencies are on the same page on TERMS AND TARGETS. How do your marketing teams and agencies define contribution margin? What’s included in COGS? When is the last time they’ve updated their targets? Make them put it on paper and share with you. No hand waving.
- Increase your vigilance of enforcing budgets. It’s ok to spend more. It’s ok to test that new thing or hire that new person. But similar to unit economics, those dollars should have a plan and a purpose. And if the environment changes, the budget should change with it. Your balance sheet can only support a finite amount of “well I guess we’ll try again next month”
Example Sensitivity Table
If you want to chat, here’s my calendar.
Thanks for reading,
Sam
