If you’ve been a reader for a while, you know we do benchmark reports. And we do them well.
I’m particularly proud of this one for what we removed – cleaner tables, less clutter, less noise.
I also want to give our financial analysts a shoutout for making this possible. Francisco and Joaquin, you guys are awesome.
The goal is the same: give you numbers you can actually use to benchmark your DTC business – less of my take, more of the raw data.
In this report, we’re comparing full-year 2025 to 2024. Revenue, gross margin, contribution margin, ROAS, G&A, fixed marketing costs, and EBITDA — all broken out by revenue cohort.

Here are my 5 biggest observations.
1. Revenue growth split in half
On average, the smallest and largest brands grew, and the middle cohort shrank.
Brands under $10M grew 24% on average (15% median).
The over-$50M cohort grew 41% on average (33% median).
But the $10M–$50M cohort declining 5% both on average and the median tells the same story – this isn’t an outlier problem. The average mid-market brand genuinely contracted.
If you’re $10M–$50M and you grew this year, you generally outperformed your peers.

2. Gross margin held where it shouldn’t have
Tariffs were supposed to have a murderous impact on on our industry last year, but the numbers show brands navigated tariffs relatively well.
The over-$50M cohort actually improved gross margin from 77% to 79%. Either they negotiated better terms, raised prices, or both.
In the middle cohort, cost pressure did show up as margins dropped about 2%. And the spread between the 5th and 95th percentiles is massive – nearly 40 points.
Gross margin remains the great filter. Below 70%, scaling is an uphill fight.

3. ROAS is down for larger brands, but the full story is more nuanced
Under-$10M brands improved ROAS by 17%. Larger cohorts declined about 9%.
That decline for the $10M+ brands lines up almost exactly with what Meta reported on their own earnings calls…ad efficiency is eroding industry-wide.
But for the smaller brands, the ROAS improvement doesn’t tell the whole story. Some of that cost likely shifted into fixed marketing spend below the contribution margin line.
Don’t look at ROAS in isolation. The brands that are winning track total customer acquisition cost of ad spend plus the infrastructure that supports it.

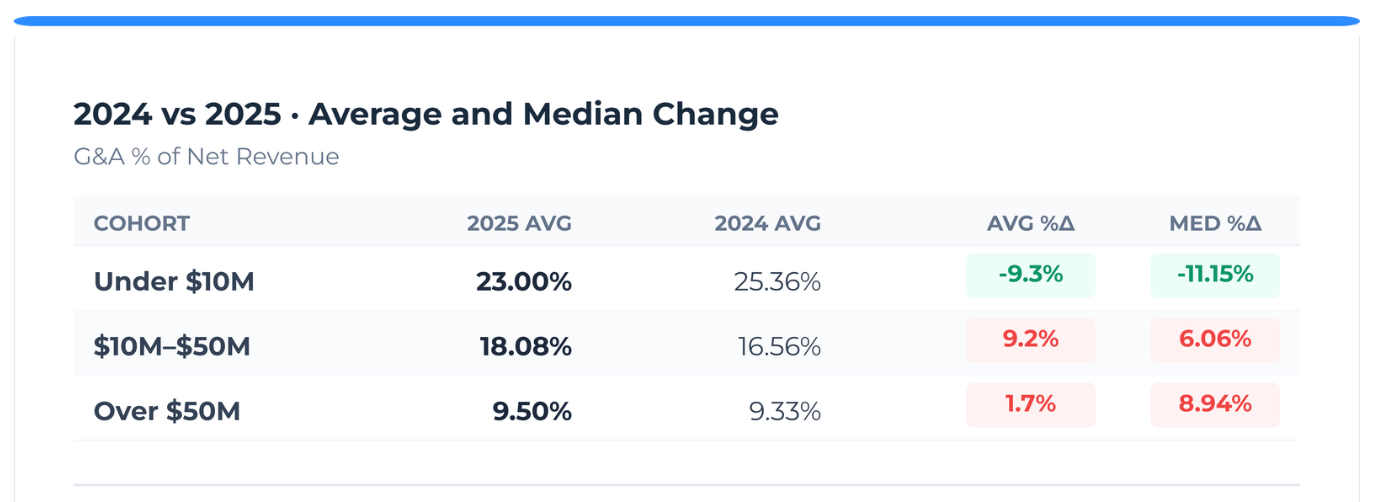
4. Only <$10M brands were more efficient with G&A
Under-$10M brands improved G&A as a percentage of revenue from 25% to 23%.
Over $50M brands were largely flat, although the median was ~9%.
What’s troubling for the middle and upper cohorts is the relationship between ROAS and G&A. I would have expected more reverse correlation in ROAS and G&A.
However, ROAS and G&A as % of revenue both declined. I continue to caution clients to cut costs a little deeper than what may seem comfortable.
5. Thank goodness (some) brands are improving EBITDA
I need to be careful with what I say about EBITDA.
We saw plenty of blood in the water last year and many companies struggle. I think some of the green in the tables below reflect a degree of survivorship bias. We only see companies we work with – and we’re not the cheapest firm in town – so we tend to see more profitable companies.
I also think there’s more green in the tables because 2024 wasn’t particularly great either – the EBITDA margin for the average $10M brand was 5%.
Having said those caveats, many brands were more profitable.

If you’re in the $10M-$50M cohort and you’re still seeing red, I have some slightly better news for you here.
Yes, the average brand in this cohort was ~30% less profitable. However, I invite you to look one column to the right. The median decline was only 2%, telling us there were some larger outliers significantly impacting the average.
I also want to highlight the percentiles for EBITDA too. We have some incredibly profitable companies in this data set. If you’re 20%+ EBITDA, you are generally in the 95th percentile of your cohort.

Heading into 2026: the end of easy mode continues
The data says operational discipline is what separates winners from losers now.
Our Revenue Planning Guide projects that most operators should baseline 2026 revenue growth around 10% — that’s what same-store performance has consistently shown across our client base. Growth above that requires a step-change lever: a hero product launch, a new channel, new geography, or an acquisition.
It won’t come from just doing what you did last year, but better.
— Sam
Looking for more? Some of our most popular posts:
- 2026 Revenue Planning Guide: Our report on macroeconomic indicators, Shopify GMV trends, and same-store revenue benchmarks to give operators a clear, data-backed outlook for 2026.
- The issue with KPIs: Everyone has tons of data, but doesn’t know what to do with it. This is my take on managing the right metrics.
- Responsibility Map: I walk through how to define who owns, participates in, and supervises every key finance & accounting deliverable
