New quarter, new benchmark report.
What I’m particularly proud of for this report is what we said “no” to.
We had the temptation to add more metrics, more detailed commentary (my thoughts), and even change the entire methodology.
But what I’m continuously reminded of is that…
- You care more about the raw data than my commentary
- How the data is aggregated and presented
- The noise is the signal
Again, we analyzed data from 20 companies, with revenues ranging under-$10M to $100M+, and pulled out trends in revenue, gross margin, contribution margin, EBITDA and more.
We also share benchmarks on everything from ad spend to ROAS, overall G&A, marketing as a percent of revenue, and more.
Our continued goal is to publish the best benchmark data in our industry to give you the data to understand your own performance.
What we’re seeing in Q2
You’ve read this 100 times now, but still every month, when we sit down with clients, we hear some version of the same question:
“What are you seeing in the market?”
We see the financials across (approaching) 100 companies of $1M to $100M+ brands. Here are the big themes from this quarter.
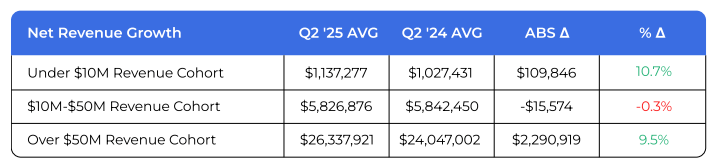
1. Revenue growth was… meh
Flat to 10% growth across all cohorts. Not exciting, not terrible.
Under-$10M brands grew 11%. Mid-market was basically flat at -0.3%. $50M+ companies hit 10%.
But averages lie.
The 95th percentile companies in every single cohort saw 31% to 57% growth. One client in the $10-50M cohort grew 43%.
Great companies find ways to grow regardless of environment. Worth asking yourself what the top performers are doing differently.
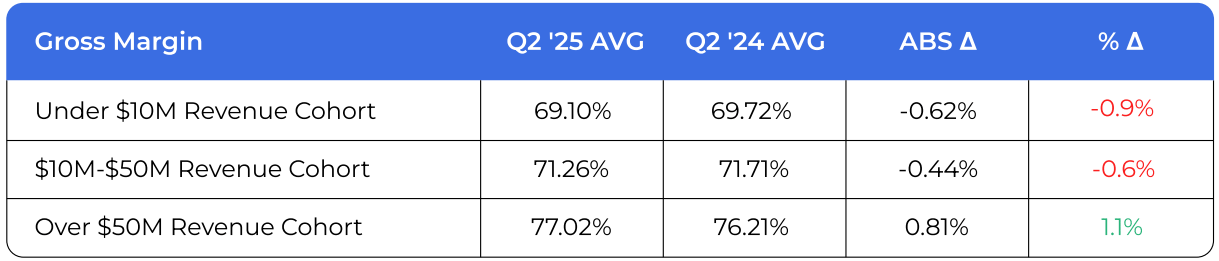
2. Gross margins held steady (for now)
I expected to see margin compression from tariffs. We didn’t see it in Q2.
Companies ordered and received inventory in Q2 amidst tariff chaos. But the impact of that higher-cost inventory will be felt over time.
The margin hit is coming in Q3 and Q4 as that inventory flows through COGS.
We’re already seeing it with one furniture client…55% tariffs hit their category last month. That’s not just margin compression – it’s an existential threat.
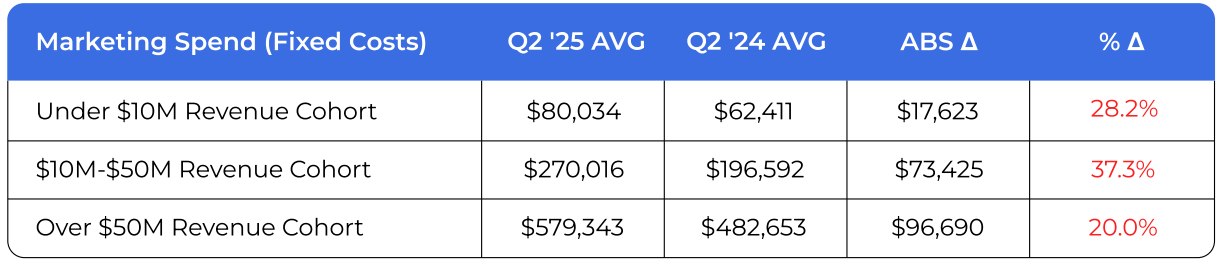
3. Marketing is hard
I expect fixed marketing and variable marketing (ads) to be roughly inversely correlated.
A reduction on the reliance on ads to acquire customers should equate to higher fixed marketing and higher ROAS.
It’s only one quarter of data, but that’s not happening.
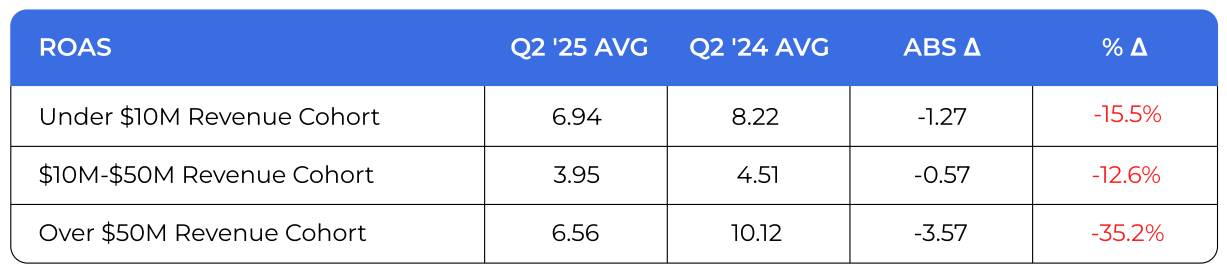
Fixed marketing costs increased between 20% and 40% and ROAS declined across every cohort by at least 10%.
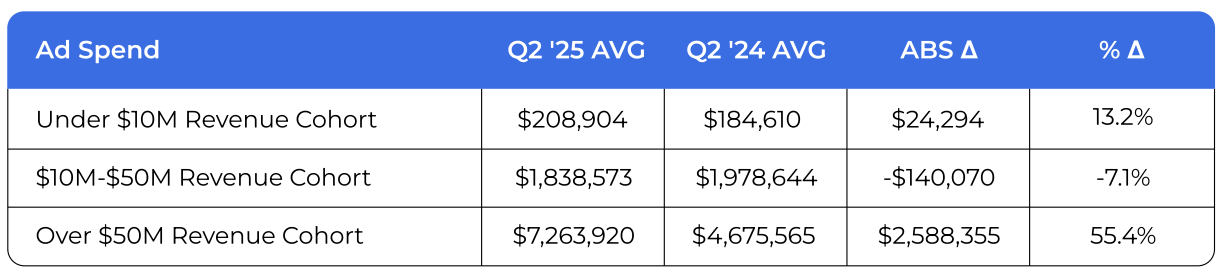
Brands invested into content, agencies, photo shoots, marketing headcount, experimental channels. One $50M+ client increased ad spend by $2.6M compared to last year.
Result? Higher spend, lower returns, compressed profitability.
Under-$10M brands saw ROAS drop 15%. $50M+ companies deployed 55% more ad dollars but saw a 35% decline in ROAS.
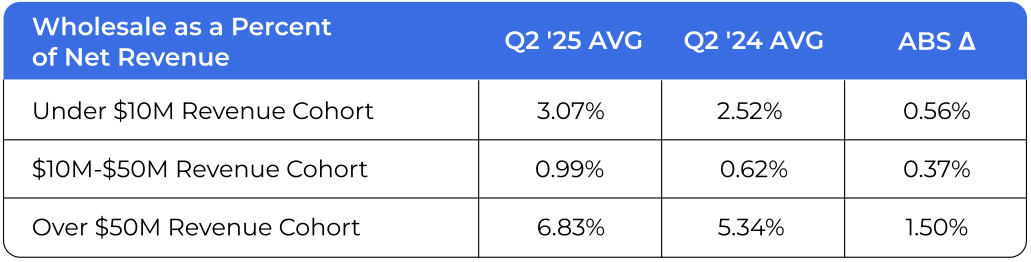
4. Wholesale is still small potatoes
Growing in some cases, declining in others. But represents no more than 7% of revenue for any D2C brand in our sample.
I know wholesale feels like it should be a bigger opportunity, but the numbers don’t support major time investment for most brands.
Focus on what’s driving the most revenue which is usually your DTC business.
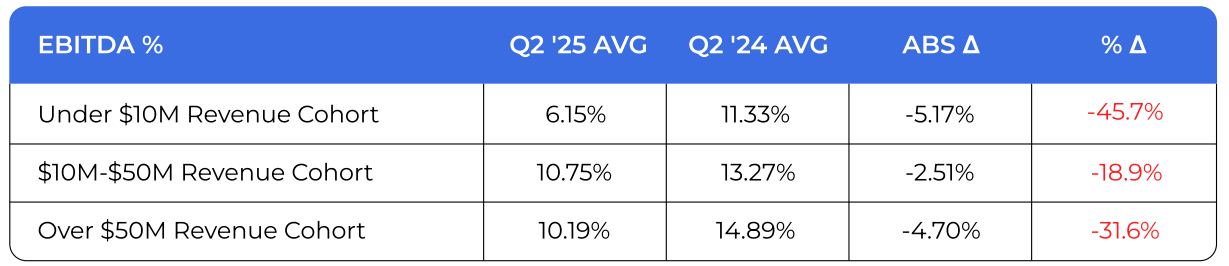
5. EBITDA got crushed everywhere
The pattern was clear: revenue up, profitability down.
G&A spending increased 10% to 39% across all cohorts. EBITDA fell across every single cohort.
Under-$10M brands went from 11.33% EBITDA to 6.15%. Mid-market dropped from 12.26% to 7.80%. $50M+ companies fell from 14.89% to 10.19%.
It’s a challenging pattern we’re seeing across the board and it’s happening to good companies.
What this means for the rest of 2025
The macro headwinds aren’t getting better. Here’s what you need to focus on:
- Look at your fixed costs carefully. Many expenses that seemed reasonable individually add up to real profit pressure. Most decisions are reversible if you need to add things back later.
- Build budgets with what you’re actually seeing. Q4 might be strong, but plan with current realities rather than hopes.
- Understand tariff impacts now. If you’re importing, work with your accounting team to model how potential tariff changes affect your unit economics. Better to know sooner.
The data shows some brands are navigating this environment better than others. Worth understanding what they’re doing differently.
For even more…
Check out the full report for all this, plus more data, insights, and CFO perspective on things like…
- G&A spending jumping 10-40% across all cohorts
- ROAS declining everywhere (and what Meta’s earnings say about ad costs)
- Why 95th percentile companies saw 31-57% growth while others stayed flat
- And more…

